
Gross world product…
…has increased more than 100x in the last 300 years

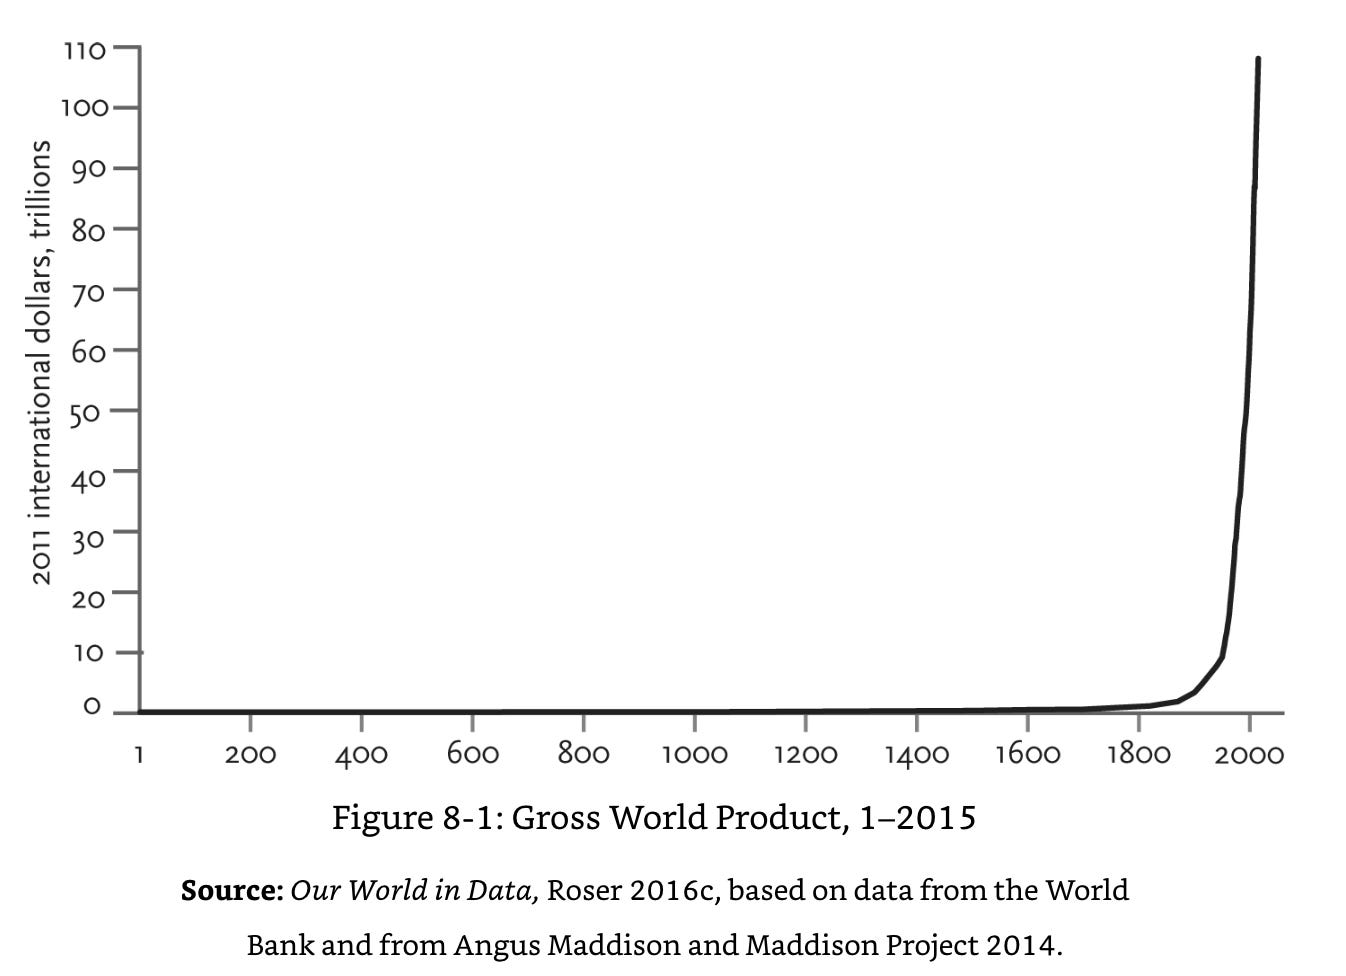
Of all the graphs I’ve come across so far, this one perhaps has the biggest ‘wow’ factor. The Gross World Product is like GDP, but for the whole world, and relative to the buying power of the dollar at a fixed period in time. The insane increase in wealth (and wealth is indeed created) is the driver behind almost all the other improvements we’ve seen and will see. Without the efficiencies and scale afforded by modern technologies and systems we’d still be struggling along trying to produce, hunt or gather the calories we need to survive.
Of course, there are still problems. Wealth is not distributed evenly, both within countries and around the world, and close to a billion people are still living in poverty. But the improvements in health and living standards for most people are real, and they are improving faster than ever.
But it turns out this graph is actually a substantial underestimate of the benefits caused by that wealth. If you were to go back to 1800 and give a man a million pounds, he could live a pretty good life. But he wouldn’t be able to buy a car, have surgery with anaesthetic or listen to any song ever made at the touch of a button.
The wealth we take for granted today was not always around. Humans created it, and we are enjoying the fruits of those years of creation today.